
Vote Pattern Analysis Thread
votepatternanalysis.substack.com/p/voting-anoma…
This article does something very interesting – quantifying how weird the middle of the night updates in Michigan, Wisconsin and Georgia were. I want to explain in simple terms what it does, and why it’s so important.
(1/N)
votepatternanalysis.substack.com/p/voting-anoma…
This article does something very interesting – quantifying how weird the middle of the night updates in Michigan, Wisconsin and Georgia were. I want to explain in simple terms what it does, and why it’s so important.
(1/N)
Tl; dr - the entire presidential election swings on the plausibility of these updates. And they look extremely unusual.
(2/N)
(2/N)
Recall, these are the places where election night saw complete banana republic stuff like boarding up windows in Wayne County vote counting centers to stop people who’d been excluded from the room even looking in.
bizpacreview.com/2020/11/05/let…
(3/N)
bizpacreview.com/2020/11/05/let…
(3/N)
You know, like normal countries do in their elections! And lo and behold, everyone went to bed thinking Trump had won, and woke up to find out he apparently hadn’t.
(4/N)
(4/N)
But we want to measure just how weird the outcome of these updates was. The piece does a sophisticated way of measuring this, but the concept is pretty simple. An vote update can either be
a) large, or
b) unlike what came before,
but it is hard to be both at once.
(5/N)
a) large, or
b) unlike what came before,
but it is hard to be both at once.
(5/N)
For instance, suppose I flip a coin 10,000 times. It comes up 5,022 heads. If I flip it only twice more, it’s easy to get an update that is small but unrepresentative – say, 100% heads from 2/2 flips.
(6/N)
(6/N)
But if I flip it another 1,000 times, it is very strange to also get 100% heads in the new batch. The more flips you have, the smaller the variation in the sample mean becomes. Updates that are large are likely to be more representative.
(7/N)
(7/N)
Now, with coins, we know for sure that the distribution is the same before and after. With votes, we don’t. Counties differ from each other, and some report in different orders.
(8/N)
(8/N)
But if each county reports its tallies in small increments at quasi random times as new numbers come in, *it turns out this relationship roughly holds in real world vote counts too*, as the analysis shows.
(9/N)
(9/N)
It holds in the 2020 election data for most states and most updates. Those with an urban/rural divide. Those who vote Democrat overall and those who vote Republican overall.
(10/N)
(10/N)
EXCEPT the glaring exceptions to this rule are the middle of the night updates in Wisconsin, Michigan, and Georgia, which swung the entire election. Metaphorically, the coin was flipped thousands of times, and it also landed massively on heads.
(11/N)
(11/N)
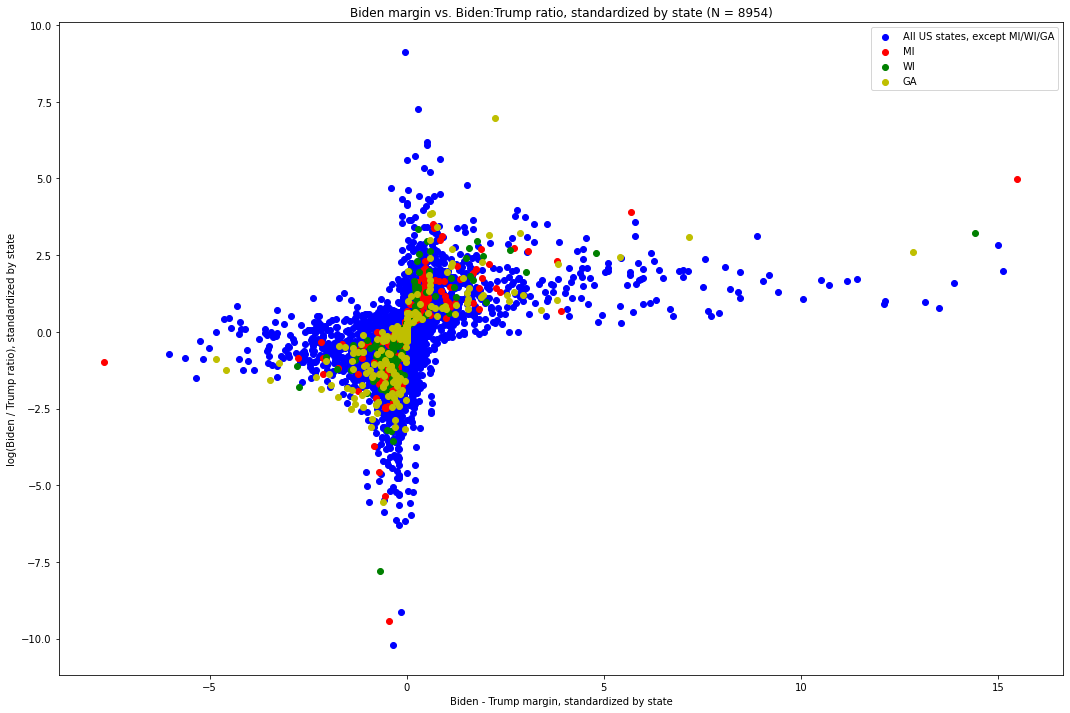
The simplest way to show this is with this is with the graph of all vote updates, standardized by the overall state vote for Biden (that is, comparing the deviation of the new batch from the state average).
(12/N)
(12/N)

This graph is complicated, but what’s it saying? The x-axis is the total net votes for Biden, relative to the size of the state total. Think of this as a rough measure of the size of the update.
(13/N)
(13/N)
Big positive numbers are big total vote increases in a way that favors for Biden. Big negative numbers are big total vote increases for trump. Zero is updates that don’t move the net margin very much. So big positive or negative just means “large”.
(14/N)
(14/N)
The y-axis is the relative ratio of support for Biden to Trump in that update. Big positive numbers show updates that are unusually tilted towards Biden, compared with what came before. Big negative numbers are updates that are unusually tilted towards Trump.
(15/N)
(15/N)
Now, what does the main mass of blue points show? It basically looks like a cross. This is exactly the point made above.
(16/N)
(16/N)
The vertical bit of the cross is updates that are small in total, but show various weird ratios for each candidate. This is when you flip the coin twice. If you’re high OR low on the y-axis (i.e. the batch is unrepresentative), it’s generally near zero (i.e. it’s small).
(17/N)
(17/N)
The horizontal axis is when you flip the coin thousands of times. Most such updates are close to the prior mean. If you’re in the left or right of the x-axis (it’s a big update favoring either candidate), you’re generally close to 0 on the y-axis (you’re representative).
(18/N)
(18/N)
Now, in the top right corner, we can see glaringly the three biggest updates that tipped the election. They are both large AND unrepresentative. This is when you suddenly release a massive batch that is ALSO nothing like what came before.
(19/N)
(19/N)
Remember, this is also measured relative to other small updates in the same state, including those from the same county!
(20/N)
(20/N)
1.An update in Michigan listed as of 6:31AM Eastern Time on November 4th, 2020, which shows 141,258 votes for Joe Biden and 5,968 votes for Donald Trump
(21/N)
(21/N)
2.An update in Wisconsin listed as 3:42AM Central Time on November 4th, 2020, which shows 143,379 votes for Joe Biden and 25,163 votes for Donald Trump
(22/N)
(22/N)
3. A vote update in Georgia listed at 1:34AM Eastern Time on November 4th, 2020, which shows 136,155 votes for Joe Biden and 29,115 votes for Donald Trump
(23/N)
(23/N)
4. An update in Michigan listed as of 3:50AM Eastern Time on November 4th, 2020, which shows 54,497 votes for Joe Biden and 4,718 votes for Donald Trump
(24/N)
(24/N)
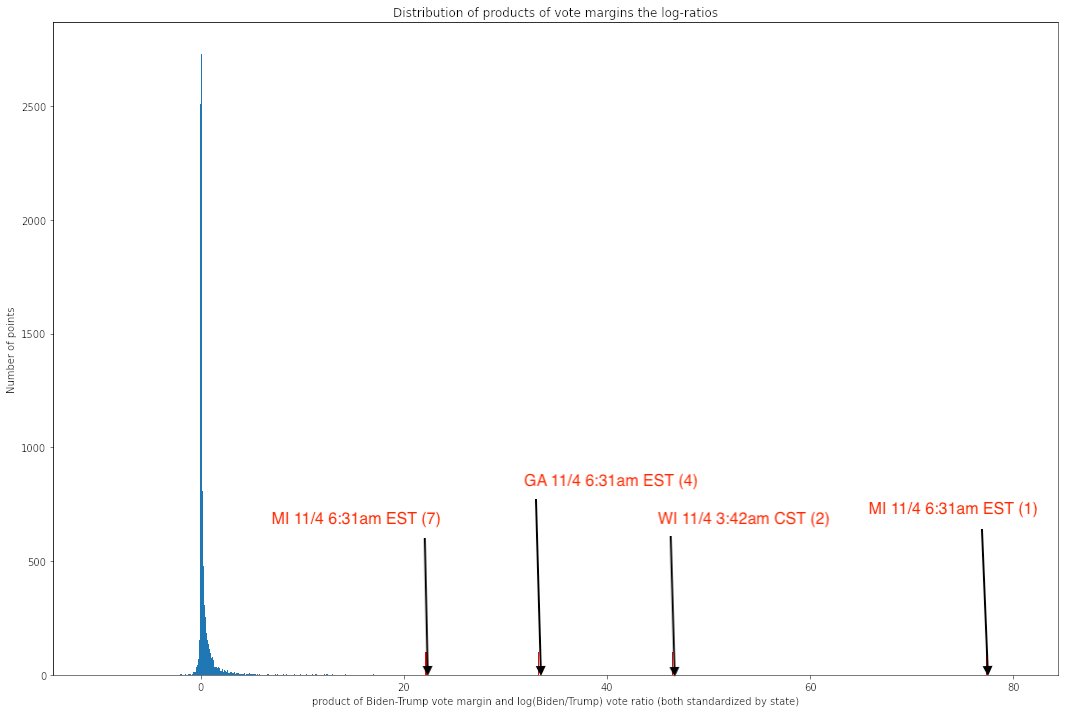
Another way to see just how weird these are is to plot the product of the two measures. The decisive updates are crazy outliers here.
(25/N)
(25/N)
So this raises a question – why would these states, unlike everywhere else in the data, wait until the middle of the night to release massive, unrepresentative counts from the Democratic strongholds in their state, when no other state does this?
(26/N)
(26/N)
Two reasons. First, because most other counties in the state have already reported in. As a consequence, you know how many votes you need to make up. And when you’re large AND reporting in last, it’s very hard for other counties to swing the outcome.
(26/N)
(26/N)
Second, because when everything is reported in one batch, and that report happens in the middle of the night, and when the counting happens with few people there to watch it, *it’s easy to just report the entire batch as a fait accompli*.
(28/N)
(28/N)
We saw with Montgomery County, that when you release multiple updates, it’s much easier to tell when the distribution changes halfway through. When you release it all at once, it’s much more difficult to prove what’s going on.
revolver.news/2020/11/explos…
(29/N)
revolver.news/2020/11/explos…
(29/N)
Finally, the report does something I haven’t seen anywhere else. It shows that if these updates were just a little more plausible in this joint property, and a little less suspicious, *the total outcome of the election gets flipped*.
(30/N)
(30/N)
In other words, it literally matters for the entire Presidency of the United States whether these magnitudes for this handful of updates is excessively implausible, or just highly unlikely.
(31/N)
(31/N)
The paper doesn’t compute explicit probabilities or p-values, but it does note that these updates are the 1st, 2nd, 4th, and 7th weirdest updates in their joint anomaly measure, out of 8,954. And they decided the election outcome.
(32/N)
(32/N)
Formal statistical tests put zero weight on all the other weirdness going on here, like these all being in the middle of the night, in swing states crucial to the election, in places with huge numbers of mail ballots, and very strong local Democratic party machines.
(33/N)
(33/N)
Milwaukee, recall, also has simultaneous suspicious shifts in down-ballot races too, as I described, in ways that are consistent with fraud, but unusual otherwise.
(34/N)
https://twitter.com/shylockh/status/1325120312455749634
(34/N)
If you didn’t have a dog in the fight, and this were some random country of no importance, what would your conclusion from all this be?
(35/N)
(35/N)
You don’t have to be a conspiracy theorist to think that there is a lot of suspicious anomalies that call into question the integrity of this election. What this update shows is that these anomalies are plausibly large enough to change the entire outcome.
/fin
/fin
• • •
Missing some Tweet in this thread? You can try to
force a refresh


