Steve Sailer Profile picture
Jun 2 6 tweets 2 min read Twitter logo Read on Twitter
I'm often asked why I try to stay up to date on the science of racial differences in average cognitive test scores. It's because IQ differences are the Occam's Razor that explain countless headlines in the New York Times that confuse and anger uninformed NYT readers. For example:
Nationally representative Adolescent Brain Cognitive Development study of 10,600 10-year-olds found in 2016-18 that Asians & part-Asians averaged 19.9 points higher than blacks, a 1.33 standard deviation gap: median Asian is at 91st percentile among blacks
takimag.com/article/mind-t…
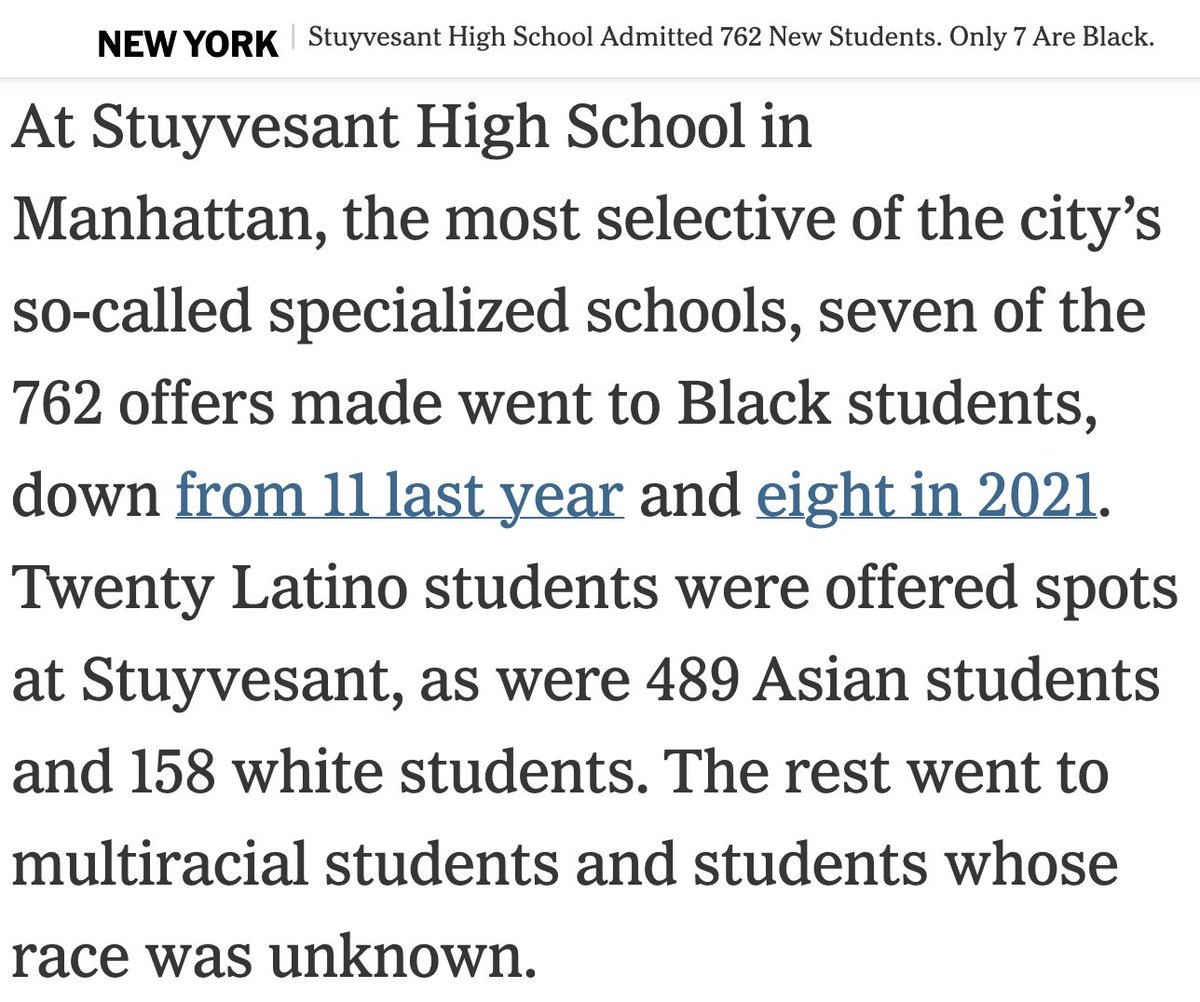
At Stuyvesant HS, the famous public STEM high school in Lower Manhattan, 64% of applicants who scored high enough on the admission test to be accepted in 2023 were Asians, 21% were white, 3% Hispanic, 1% black, and 11% mixed, unknown, or other.

nytimes.com/2023/06/02/nyr… Image
If you are a black NYC student who is smart enough to test into the Stuyvesant public STEM school, you are likely smart enough as well to be offered a near-full ride to a world famous private school like Horace Mann, Brearley, Collegiate, or Ethical Culture.
Therefore, why attend Stuyvesant HS with all the Asian immigrant grinds when, for roughly the same price (free), you could attend, say, Dalton with the kids of celebrities and Masters of the Universe? So why bother with Stuyvesant?
Say it takes a 125 IQ to test into Stuyvesant HS. In the nationally representative ABCD database of 10,600 10 year olds in 2016-18, Asians and Part Asians averaged 105.1 (with whites set to 100,) blacks 85.2, so an individual Asian would be about 23 times more like to score 125.

• • •

Missing some Tweet in this thread? You can try to force a refresh
 

Keep Current with Steve Sailer

Steve Sailer Profile picture

Stay in touch and get notified when new unrolls are available from this author!

Read all threads

This Thread may be Removed Anytime!

PDF

Twitter may remove this content at anytime! Save it as PDF for later use!

Try unrolling a thread yourself!

how to unroll video
  1. Follow @ThreadReaderApp to mention us!

  2. From a Twitter thread mention us with a keyword "unroll"
@threadreaderapp unroll

Practice here first or read more on our help page!

More from @Steve_Sailer

May 25
Today, May 25th, is the third anniversary of George Floyd's death.

How's that whole "racial reckoning" thing working out anyway?

It's starting to look like the harder heads of the Democrat-media industrial complex have decided it's best to memoryhole their 2020 mania.
The CDC tracks the cause of each death. Here's the weekly number of blacks dying by homicide (red) and motor vehicle accident (blue) by week from 2018 to late 2022. After George Floyd's death, black homicides jumped from a trend line of ~200 to ~300/wk and car crash deaths up ~45 Image
The Occam's Razor explanation for why blacks suddenly died so many more Deaths of Exuberance (murders and traffic accidents) immediately after the cops retreated to the donut shop during the triumph of Black Lives Matter in 2020 is that black lives depend upon law and order.
Read 5 tweets
May 24
Riffing on Cecil Deaton's 2015 discovery of rising white white working class Deaths of Despair (suicide, opioid overdose, cirrhosis), I coined the term Deaths of Exuberance for rising black homicide and car crash deaths during the "racial reckoning" since George Floyd. Image
For a spectacular example of Deaths of Exuberance, observe the drunk and high Usual Suspect who killed 3 on D.C.'s Rock Creek Parkway in March by driving her Lexus into them at 100 mph while fleeing the police because her boyfriend had an illegal gun:

unz.com/isteve/usual-s… Image
With the 3rd anniversary of the epochal death of George Floyd coming up on Thursday, it's time for the media to notice finally how much their vaunted "racial reckoning" at the behest of Black Lives Matter unleashed a historically novel surge in black deaths by homicide and crash. Image
Read 5 tweets
Apr 5
The U. of California banned SAT/ACT admissions tests in 2021. The data is now available for 2022 acceptances and it looks like dumping the SAT was a disaster for UC San Diego's freshman class quality.

takimag.com/article/low-gr…
In 2020, 2,878 students from majority Asian and white L.A. County public schools were accepted by UC San Diego. This dropped to 2,199 in 2022 (down 24%).

In contrast, 1,601 applicants from majority black and Hispanic schools were accepted in 2020, but 5,130 in 2022 (up 215%).
How’d UC San Diego make room for all these extra low test score students from unchallenging public schools? Upscale public school acceptances were down 24%, private schools down 41%, out-of-staters down 24%, and internationals down 25%.

takimag.com/article/low-gr…
Read 4 tweets
Feb 18
CDC: High school boys are suffering from epidemics of sobriety and virginity:

unz.com/isteve/cdc-hig…
High school boys are also suffering from a sobriety epidemic:

unz.com/isteve/cdc-hig…
Also, while it may not smell like this to me while I'm walking my dog down the street, high school boys report that they are increasingly unbaked:

unz.com/isteve/cdc-hig…
Read 8 tweets
Feb 15
Even when adjusted for their parents' level of affluence, black men are four times more likely to be incarcerated than white men raised at the same level of affluence, with the ratio rising to 10 to 1 for those from the richest One Percent.

That's nuts.

takimag.com/article/americ…
Blacks commit about an order of magnitude more murders than whites. Is this because they are poorer as adolescents?

takimag.com/article/2013-a…

My graph based on Harvard economist Raj Chetty's massive database: black men are incarcerated 4x white men with equally affluent parents: Image
Among men raised in the dirt-poor lowest percentile of parental income, blacks are 3.3 times as likely to be imprisoned as whites.
At the 25th %ile, blacks are confined 3.9 times as often.
50th %ile: 4.5x
75th %ile: 5.0x
98th %ile: 6.7x
100th %ile: 10.7x

takimag.com/article/americ…
Read 6 tweets
Feb 11
From Harvard economist Raj Chetty's data: Horizontal axis is percentile of parents' income 1994-2000. The black line is the % of black males born c. 1980 who were incarcerated on April 1, 2010, the blue line white males locked up.

unz.com/isteve/chetty-…
The red line, measured against the right vertical axis, is the ratio of % of black males incarcerated to % of white males incarcerated. It rises from about 3 to 1 for the poorest Americans to about 7 to 1 among the richest, before exploding to 10 to 1 for the richest one percent.
There are only about 1800 blacks who were raised in the top 1% of parents' income vs. 186,000 whites. My guess is that Top 1% highest paid black families tend to be more athletes and entertainers, while Top 5% tend to be more CPAs and JDs. So that may explain 10:1 ratio at top.
Read 6 tweets

Did Thread Reader help you today?

Support us! We are indie developers!


This site is made by just two indie developers on a laptop doing marketing, support and development! Read more about the story.

Become a Premium Member ($3/month or $30/year) and get exclusive features!

Become Premium

Don't want to be a Premium member but still want to support us?

Make a small donation by buying us coffee ($5) or help with server cost ($10)

Donate via Paypal

Or Donate anonymously using crypto!

Ethereum

0xfe58350B80634f60Fa6Dc149a72b4DFbc17D341E copy

Bitcoin

3ATGMxNzCUFzxpMCHL5sWSt4DVtS8UqXpi copy

Thank you for your support!

Follow Us on Twitter!

:(